


PROGRAMMED Research Activities
A new approach for our next phase
To secure the financing our partner countries need and to ensure it is spent effectively, countries need knowledge based on data and, where this is not already available, it has to come from research. Coherent quantitative and qualitative assessment frameworks, and relevant high-quality data can support the local creation of policies for resilient energy and transport system development, high impact economic opportunities and plausible sustainable futures.
Our strategy revision addresses concerns that current assessment frameworks often do not reflect country contexts, fail to consider political context, are not ‘owned’ by institutions in the region, focus on climate rather than development priorities, or are too reliant on approaches from developed regions that are not transferrable to the LMIC context.
It also aims to ensure that future work takes into account the impacts of investment opportunities on the socio-economic situation, Gender Equality and Social Inclusion (GESI), and access to basic services for local communities. We intend that this future work will be co-created and delivered in partnership with local and international stakeholders. We aim to build on the success of the previous three years in which we produced 60 academic papers.
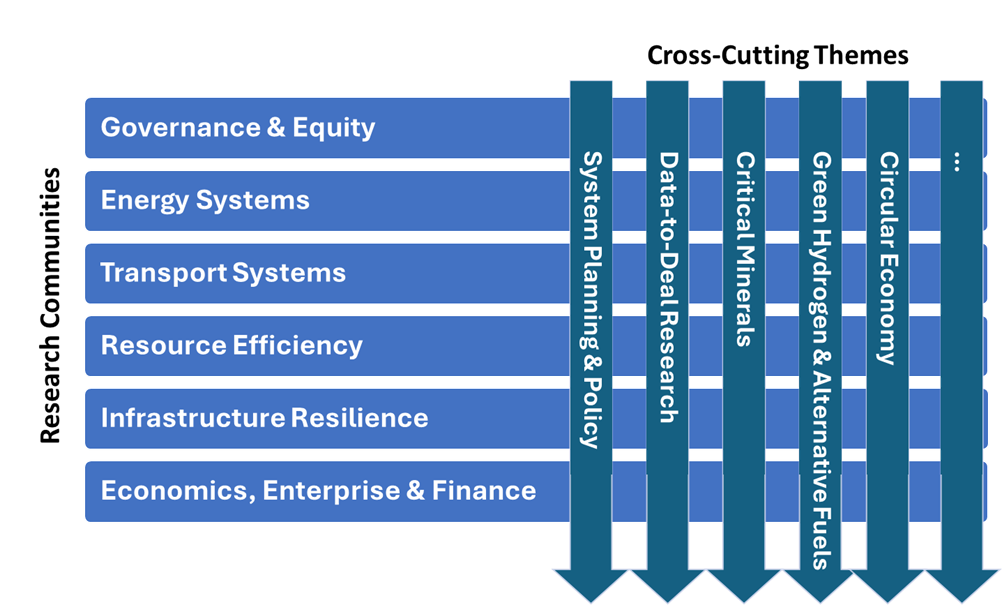
Research Communities and Cross-Cutting Themes
As CCG research progresses from phase 1 to phase 2, focus areas are being adjusted to serve emerging country and regional demands, and research organisation is being adjusted to better facilitate internal and external collaboration on research efforts. Research in phase 1 was organised in a set of three workstreams, further broken down into sub-workstreams.
CCG Programmed Research is organized into Research Communities, each representing an interdisciplinary community of knowledge. Expertise from one or more Research Communities is brought together in Research Projects to tackle research questions aligned with a set of collaborative research priority areas, known as Cross-Cutting Themes. This framework is shown in Figure 1.