In this article we take a deeper dive into a recent paper: “MUSE-RASA captures human dimension in climate-energy-economic models via global geoAI-ML agent datasets”. The lead author was Diego Moya, from Imperial College London. He was joined by Sara Giarola and Adam Hawkes also from Imperial, Dennis Copara and Alexis Olivo both from Institute for Applied Sustainability Research, IIASUR, Ecuador and Christian Castro, Universidad Técnica de Ambato.

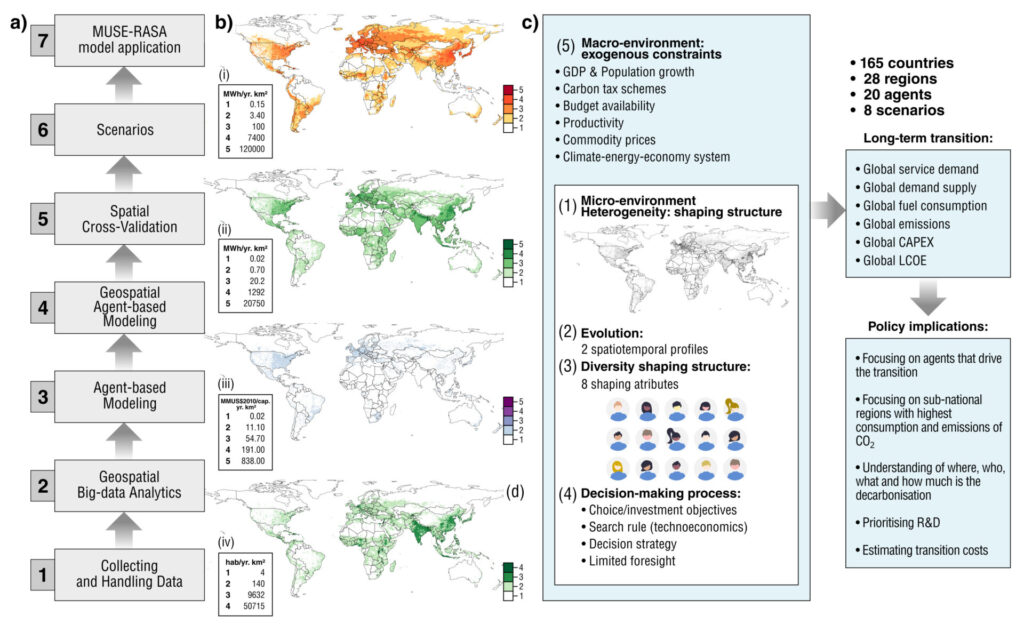
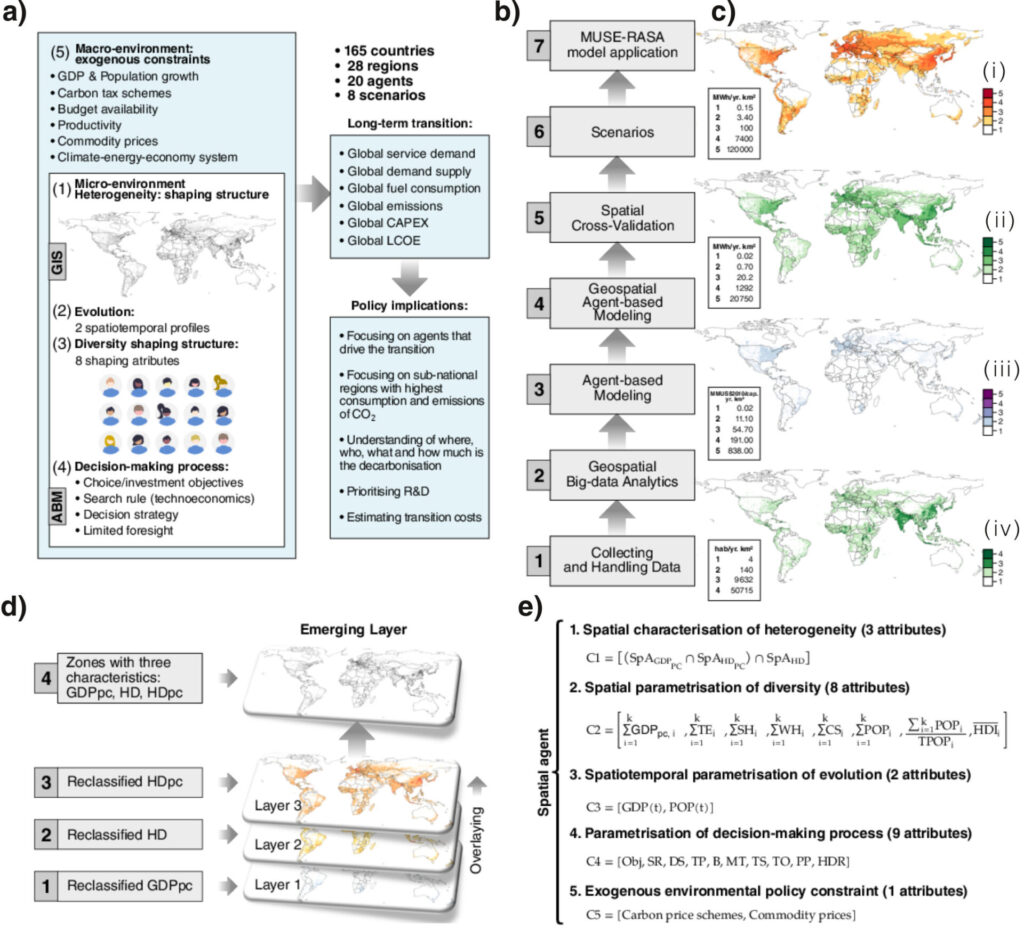
The abstract for this paper explains that it “provides a combined geospatial artificial intelligence-machine learning (geoAI-ML), agent-based, data-driven, technology-rich, bottom-up approach and datasets for capturing the human dimension in climate-energy-economy models”. So we know we are in new territory. The methodology starts by collecting and handling data and ends with the application of the ModUlar energy system Simulation Environment (MUSE), ResidentiAl Spatially-resolved and temporal-explicit Agents (RASA) model. The framework and datasets are key for climate-energy-economy models considering consumer behaviour and bounded rationality in more realistic decision-making processes beyond traditional approaches.
Very simply, what does MUSE RASA do?
MUSE RASA is like the soft-linking of an integrated assessment model to a geospatial agent-based model. The MUSE part was developed by Imperial College under the direction of Adam Hawkes, and the RASA element is part of my PhD thesis.
I used geospatial artificial intelligence-machine learning (geoAI-ML) methods when developing the RASA model and combined both MUSE and RASA to have the final results that we have put in the Nature Portfolio Journal, Scientific Data to publish the framework and datasets to reproduce the approach.
MUSE is an integrated assessment model that captures decision-making based on an agent-based approach which is the key feature of this model. What that means is it considers the motivations of how consumers or “agents” (who could also be investors) make their decisions. That’s the key difference from all the other models out there.
The RASA part – I used geospatial tools to define and parametrise those agents that I want to use in MUSE. When I say “agents”, I’m referring to energy consumers in the residential sector at global scale. Residential is the ‘R’ in RASA. So, we did this globally, considering different geospatial characteristics. The first characteristic was heterogeneity. The next characteristics we found were the diversity and evolution of these energy consumers across space and time.
The idea of using all of these tools and data is to characterise the agents, to give them a number, to see how many agents there are, and how they might behave in terms of these geospatial characteristics within the model. To do this, we are considering the actual economic output of population per country, their actual energy demand and their propensity to use specific energy technologies; everything at 1 km2.
My understanding is that you’re addressing the fact that this level of contextual complexity was not reflected in the models that were run before as they assumed that everyone behaved in the same way – is that correct?
Exactly, that’s where we started the discussion. Most of the energy systems models look at what we call ‘the mainstream’ assumptions which at the basic level, millions of consumers are deliberately represented as a single agent that takes prices as given, making rational choices with perfect knowledge of the market under rational expectations to maximize welfare, subject to budget constraints; this is also called a hyperrational representative agent.
Usually, those models neglect the human representation in the assessment because it’s difficult and complex. So, what we’re trying to do here is present these complexities in a very straightforward way as we don’t want to complicate things further or introduce new biases. What we do is to use both geospatial data and geoAI tools to represent reality. Whereas in the mainstream, this complex piece might be considered as the introduction of bias, here in the MUSE-RASA, this is considered as the introduction of more realism in the assessment. That discussion – and this article – is very provocative in that sense because we are challenging the mainstream assumptions.
So you have done a lot of work to create a large dataset of geospatial information. Does that include the whole globe or is it a cross section that is meant to be representative of that?
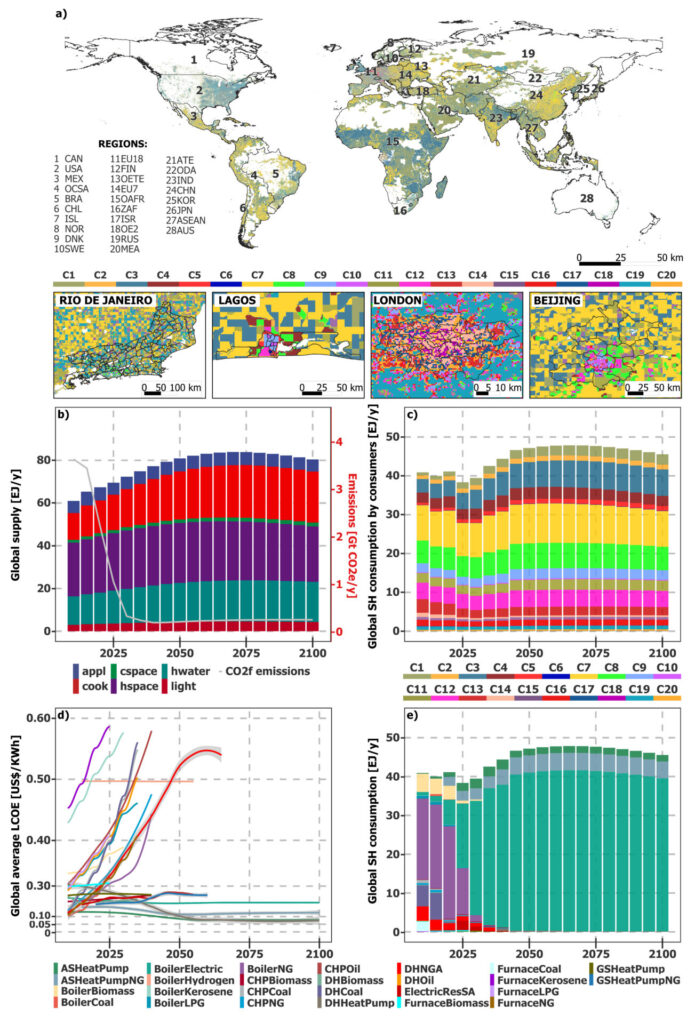
That’s another key feature – we covered the whole world. The data sets that we are using include population density and population count. Populations are counted at one square kilometre spatial resolution. So everyone living within each square kilometre in the whole world has been included. When we start to aggregate all the variable, for example, GDP or GDP per capita, or heat demand or energy demand density, we can do it at the level of one square kilometre. Then we start building up from there, aggregating from 1 km2 to the national and regional level. MUSE-RASA aggregates the results in 28 regions globally, for 20 energy consumers regardless of their geographical borders, for 8 different scenarios and assessing about 60 heating and cooling technologies for the residential sector. This makes the MUSE-RASA a combined geospatial artificial intelligence-machine learning, agent-based, data-driven, technology-rich, bottom-up approach for capturing the human dimension in climate-energy-economy models.
What was the origin of this project?
This goes back to discussions we started in 2017. Adam and his team were already working on this back in 2014 with postdoctoral fellows and other researchers. The idea for me was to implement the MUSE model. We had the discussion on how to introduce the geospatial and human dimensions and we thought that the residential sector was one sector with the transition challenges in which we could use this tool to address this issue. That was the genesis of this project. We found a couple of datasets at the right global scale and did some calculations with that on energy demand and demand density. From that we had the first paper that we produced.
So there wasn’t a country client at that point? The approach is applicable to everybody who wants to use it.
The idea was to create a framework that can be applied anywhere in the world. More granular data can be used for calibration and validation purposes. In that regard, we use data from two countries, the UK and , at the city level to validate our results. We found less than 5% in difference.
Who do you expect to use this database now? Is there a certain level of professional who you think will get the most benefit from it?
We researchers always want everyone to use our research to have impact. This research outcomes would be useful for governments and it could also be valuable for local governments – municipalities – it would be useful to them especially when they are planning their cities because it has lots of data on the residential sector which is a key player in the whole energy sector.
Also for investors because we’re providing information about what might be coming in this sector, including energy demand and supply plus the technologies that can be applied for those different types of agents that we mentioned. So investors also could be good users of this resource because we have many key metrics for them to use when they’re thinking about how to invest and how to prioritise. They can do this at the national level but also in very specific zones at the city level, for instance – the data allows them to do target these very specifically by socioeconomic and technical characteristics.
What kind of tangible impact do you think the use of this more accurate data will make? Will it help investors avoid wasted finance for example?
Let me answer that with an example from using energy to heat our homes. One key metric that we need, in order to judge if a project is economically feasible, is something called heat demand density and that’s one of the datasets we provide in this article. As we have this information at one square kilometre, it’s easier for developers to see if ground-based heat pumps are an option in the specific location under assessment. Where the heat density is lower, the options could be limited to only heating electric boilers. Where the heat density is higher, the options with high technical and economic feasibility could be district heating and heat pumps. That’s one positive aspect.
Decision makers would need to change the way they do their assessments. Right now, there isn’t much capacity to use this type of data. It is probably that more skilled professionals on geospatial analysis, consumer choices, and integrated assessment modelling would be required in energy planning multidisciplinary teams.
Is MUSE RASA similar to other energy modelling tools and would users need to train specifically in how to use it?
MUSE RASA is a framework. The MUSE is a model which can be approached like OSeMOSYS for example. The coding of the RASA part hasn’t been shared so far due to time. The data from MUSE RASA can be integrated into any other models.